
Page 274 - Annual Report PT Fast Food Indonesia Tbk 2024
P. 274
LAPORAN KEBERLANJUTAN
SUSTAINABILITY REPORT
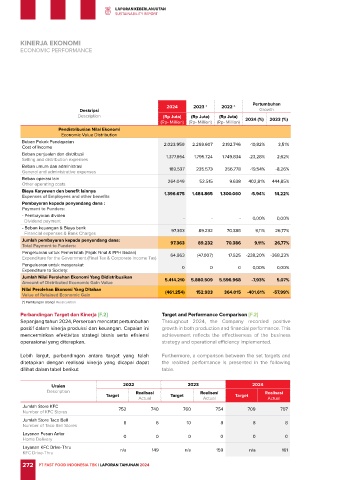
KINERJA EKONOMI
ECONOMIC PERFORMANCE
Pertumbuhan
2024 2023 * 2022 *
Deskripsi Growth
Description (Rp Juta) (Rp Juta) (Rp Juta)
(Rp- Million) (Rp- Million) (Rp- Million) 2024 (%) 2023 (%)
Pendistribusian Nilai Ekonomi
Economic Value Distribution
Beban Pokok Pendapatan
Cost of Income 2.023.959 2.269.607 2.192.746 -10,82% 3,51%
Beban penjualan dan distribusi 1.377.664 1.795.724 1.749.834 -23,28% 2,62%
Selling and distribution expenses
Beban umum dan administrasi 189.537 235.573 256.778 -19,54% -8,26%
General and administrative expenses
Beban operasi lain 264.049 52.515 9.638 402,81% 444,85%
Other operating costs
Biaya Karyawan dan benefit lainnya 1.396.675 1.484.865 1.300.060 -5,94% 14,22%
Expenses of Employees and other benefits
Pembayaran kepada penyandang dana :
Payment to Funders:
- Pembayaran dividen - - - 0,00% 0,00%
Dividend payment
- Beban keuangan & Biaya bank 97.363 89.232 70.386 9,11% 26,77%
Financial expenses & Bank Charges
Jumlah pembayaran kepada penyandang dana: 97.363 89.232 70.386 9,11% 26,77%
Total Payment to Funders:
Pengeluaran untuk Pemerintah (Pajak Final & PPH Badan) 64.963 (47.007) 17.525 -238,20% -368,23%
Expenditure for the Government (Final Tax & Corporate Income Tax)
Pengeluaran untuk masyarakat 0 0 0 0,00% 0,00%
Expenditure to Society:
Jumlah Nilai Perolehan Ekonomi Yang Didistribusikan 5.414.210 5.880.509 5.596.968 -7,93% 5,07%
Amount of Distributed Economic Gain Value
Nilai Perolehan Ekonomi Yang Ditahan
Value of Retained Economic Gain (461.254) 152.933 364.015 -401,61% -57,99%
(*) Perhitungan Ulang | Recalculation
Perbandingan Target dan Kinerja [F.2] Target and Performance Comparison [F.2]
Sepanjang tahun 2024, Perseroan mencatat pertumbuhan Throughout 2024, the Company recorded positive
positif dalam kinerja produksi dan keuangan. Capaian ini growth in both production and financial performance. This
mencerminkan efektivitas strategi bisnis serta efisiensi achievement reflects the effectiveness of the business
operasional yang diterapkan. strategy and operational efficiency implemented.
Lebih lanjut, perbandingan antara target yang telah Furthermore, a comparison between the set targets and
ditetapkan dengan realisasi kinerja yang dicapai dapat the realized performance is presented in the following
dilihat dalam tabel berikut: table.
Uraian 2022 2023 2024
Description Realisasi Realisasi Realisasi
Target Target Target
Actual Actual Actual
Jumlah Store KFC 752 740 760 754 709 707
Number of KFC Stores
Jumlah Store Taco Bell
Number of Taco Bell Stores 8 6 10 8 8 8
Layanan Pesan Antar
Home Delivery 0 0 0 0 0 0
Layanan KFC Drive-Thru n/a 149 n/a 159 n/a 161
KFC Drive-Thru
272 PT FAST FOOD INDONESIA TBK | LAPORAN TAHUNAN 2024