
Page 306 - Laporan Tahunan KFC 2025_low22.56
P. 306
TANGGUNG JAWAB SOSIAL DAN LINGKUNGAN
Corporate Social Responsibility and Environmental Responsibility
KINERJA EKONOMI ECONOMIC PERFORMANCE
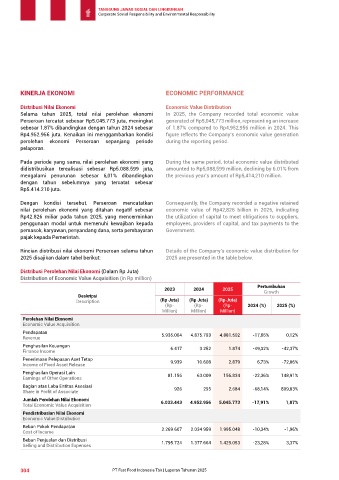
Distribusi Nilai Ekonomi Economic Value Distribution
Selama tahun 2025, total nilai perolehan ekonomi In 2025, the Company recorded total economic value
Perseroan tercatat sebesar Rp5.045.773 juta, meningkat generated of Rp5,045,773 million, representing an increase
sebesar 1,87% dibandingkan dengan tahun 2024 sebesar of 1.87% compared to Rp4,952,956 million in 2024. This
Rp4.952.956 juta. Kenaikan ini menggambarkan kondisi figure reflects the Company’s economic value generation
perolehan ekonomi Perseroan sepanjang periode during the reporting period.
pelaporan.
Pada periode yang sama, nilai perolehan ekonomi yang During the same period, total economic value distributed
didistribusikan terealisasi sebesar Rp5.088.599 juta, amounted to Rp5,088,599 million, declining by 6.01% from
mengalami penurunan sebesar 6,01% dibandingkan the previous year’s amount of Rp5,414,210 million.
dengan tahun sebelumnya yang tercatat sebesar
Rp5.414.210 juta.
Dengan kondisi tersebut, Perseroan mencatatkan Consequently, the Company recorded a negative retained
nilai perolehan ekonomi yang ditahan negatif sebesar economic value of Rp42,826 billion in 2025, indicating
Rp42.826 miliar pada tahun 2025, yang mencerminkan the utilization of capital to meet obligations to suppliers,
penggunaan modal untuk memenuhi kewajiban kepada employees, providers of capital, and tax payments to the
pemasok, karyawan, penyandang dana, serta pembayaran Government.
pajak kepada Pemerintah.
Rincian distribusi nilai ekonomi Perseroan selama tahun Details of the Company’s economic value distribution for
2025 disajikan dalam tabel berikut: 2025 are presented in the table below.
Distribusi Perolehan Nilai Ekonomi (Dalam Rp Juta)
Distribution of Economic Value Acquisition (in Rp million)
2023 2024 2025 Pertumbuhan
Growth
Deskripsi
Description (Rp Juta) (Rp Juta) (Rp Juta)
(Rp- (Rp- (Rp- 2024 (%) 2025 (%)
Million) Million) Million)
Perolehan Nilai Ekonomi
Economic Value Acquisition
Pendapatan 5.935.004 4.875.793 4.881.502 -17,85% 0,12%
Revenue
Penghasilan Keuangan 6.417 3.252 1.874 -49,32% -42,37%
Finance Income
Penerimaan Pelepasan Aset Tetap 9.939 10.608 2.879 6,73% -72,86%
Income of Fixed Asset Release
Penghasilan Operasi Lain
Earnings of Other Operations 81.156 63.009 156.834 -22,36% 148,91%
Bagian atas Laba Entitas Asosiasi 926 295 2.684 -68,14% 809,83%
Share in Profit of Associate
Jumlah Perolehan Nilai Ekonomi 6.033.443 4.952.956 5.045.773 -17,91% 1,87%
Total Economic Value Acquisition
Pendistribusian Nilai Ekonomi
Economic Value Distribution
Beban Pokok Pendapatan 2.269.607 2.034.959 1.995.048 -10,34% -1,96%
Cost of Income
Beban Penjualan dan Distribusi
Selling and Distribution Expenses 1.795.724 1.377.664 1.429.053 -23,28% 3,37%
304 PT Fast Food Indonesia Tbk | Laporan Tahunan 2025