
Page 155 - Annual Report PT Fast Food Indonesia Tbk 2024
P. 155
TINJAUAN KEUANGAN
FINANCIAL REVIEW
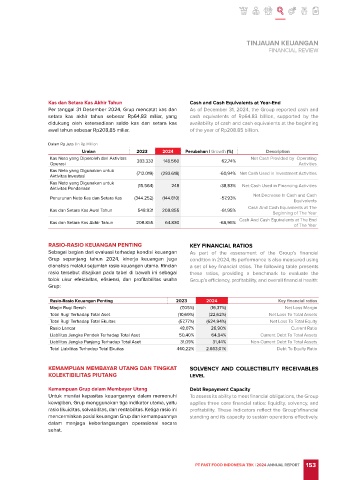
Kas dan Setara Kas Akhir Tahun Cash and Cash Equivalents at Year-End
Per tanggal 31 Desember 2024, Grup mencatat kas dan As of December 31, 2024, the Group reported cash and
setara kas akhir tahun sebesar Rp64,83 miliar, yang cash equivalents of Rp64.83 billion, supported by the
didukung oleh ketersediaan saldo kas dan setara kas availability of cash and cash equivalents at the beginning
awal tahun sebesar Rp208,85 miliar. of the year of Rp208.85 billion.
Dalam Rp Juta | In Rp Million
Uraian 2023 2024 Perubahan | Growth (%) Description
Kas Neto yang Diperoleh dari Aktivitas Net Cash Provided by Operating
Operasi 383.332 148.560 62,74% Activities
Kas Neto yang Digunakan untuk (712.019) (293.618) -60,94% Net Cash Used in Investment Activities
Aktivitas Investasi
Kas Neto yang Digunakan untuk (15.564) 248 -38,83% Net Cash Used in Financing Activities
Aktivitas Pendanaan
Net Decrease In Cash and Cash
Penurunan Neto Kas dan Setara Kas (344.252) (144.810) -57,93%
Equivalents
Cash And Cash Equivalents at The
Kas dan Setara Kas Awal Tahun 548.931 208.855 -61,95%
Beginning of The Year
Cash And Cash Equivalents at The End
Kas dan Setara Kas Akhir Tahun 208.855 64.830 -68,96%
of The Year
RASIO-RASIO KEUANGAN PENTING KEY FINANCIAL RATIOS
Sebagai bagian dari evaluasi terhadap kondisi keuangan As part of the assessment of the Group’s financial
Grup sepanjang tahun 2024, kinerja keuangan juga condition in 2024, its performance is also measured using
dianalisis melalui sejumlah rasio keuangan utama. Rincian a set of key financial ratios. The following table presents
rasio tersebut disajikan pada tabel di bawah ini sebagai these ratios, providing a benchmark to evaluate the
tolok ukur efektivitas, efisiensi, dan profitabilitas usaha Group’s efficiency, profitability, and overall financial health:
Grup:
Rasio-Rasio Keuangan Penting 2023 2024 Key financial ratios
Marjin Rugi Bersih (7,05%) (16,37%) Net Loss Margin
Total Rugi Terhadap Total Aset (10,69%) (22,62%) Net Loss To Total Assets
Total Rugi Terhadap Total Ekuitas (57,77%) (624,94%) Net Loss To Total Equity
Rasio Lancar 48,07% 26,90% Current Ratio
Liabilitas Jangka Pendek Terhadap Total Aset 50,40% 64,94% Current Debt To Total Assets
Liabilitas Jangka Panjang Terhadap Total Aset 31,09% 31,44% Non-Current Debt To Total Assets
Total Liabilitas Terhadap Total Ekuitas 440,22% 2.663,01% Debt To Equity Ratio
KEMAMPUAN MEMBAYAR UTANG DAN TINGKAT SOLVENCY AND COLLECTIBILITY RECEIVABLES
KOLEKTIBILITAS PIUTANG LEVEL
Kemampuan Grup dalam Membayar Utang Debt Repayment Capacity
Untuk menilai kapasitas keuangannya dalam memenuhi To assess its ability to meet financial obligations, the Group
kewajiban, Grup menggunakan tiga indikator utama, yaitu applies three core financial ratios: liquidity, solvency, and
rasio likuiditas, solvabilitas, dan rentabilitas. Ketiga rasio ini profitability. These indicators reflect the Group’sfinancial
mencerminkan posisi keuangan Grup dan kemampuannya standing and its capacity to sustain operations effectively.
dalam menjaga keberlangsungan operasional secara
sehat.
PT FAST FOOD INDONESIA TBK | 2024 ANNUAL REPORT 153