
Page 12 - Laporan Tahunan KFC 2025_low22.56
P. 12
IKHTISAR UTAMA
IKHTISAR UTAMA
Highlights
Highlights
IKHTISAR KEUANGAN
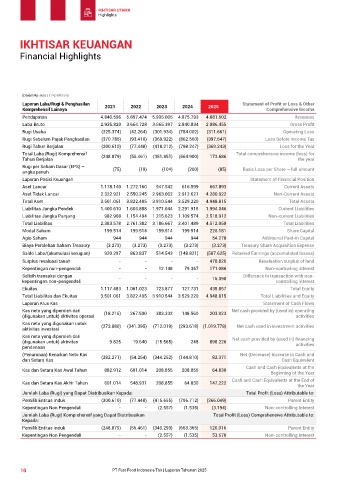
Financial Highlights
(Dalam Rp Juta | In Rp Million)
Laporan Laba/Rugi & Penghasilan 2021 2022 2023 2024 2025 Statement of Profit or Loss & Other
Komprehensif Lainnya Comprehensive Income
Pendapatan 4.840.596 5.857.474 5.935.005 4.875.793 4.881.502 Revenues
Laba Bruto 2.935.820 3.664.728 3.665.397 2.840.834 2.886.455 Gross Profit
Rugi Usaha (325.374) (42.264) (301.934) (784.002) (311.661) Operating Loss
Rugi Sebelum Pajak Penghasilan (370.785) (93.410) (369.922) (862.560) (397.547) Loss Before Income Tax
Rugi Tahun Berjalan (300.610) (77.448) (418.212) (798.247) (369.243) Loss for the Year
Total Laba (Rugi) Komprehensif Total comprehensive income (loss) for
Tahun Berjalan (248.879) (56.461) (351.851) (664.900) 173.686 the year
Rugi per Saham Dasar (EPS) – (75) (19) (104) (200) (85) Basic Loss per Share – full amount
angka penuh
Laporan Posisi Keuangan Statement of Financial Position
Aset Lancar 1.178.140 1.272.160 947.542 616.599 667.893 Current Assets
Aset Tidak Lancar 2.322.921 2.550.245 2.963.002 2.912.621 4.280.922 Non-Current Assets
Total Aset 3.501.061 3.822.405 3.910.544 3.529.220 4.948.815 Total Assets
Liabilitas Jangka Pendek 1.400.610 1.606.888 1.971.044 2.291.915 1.994.046 Current Liabilities
Liabilitas Jangka Panjang 982.968 1.154.494 1.215.623 1.109.574 2.518.912 Non-current Liabilities
Total Liabilitas 2.383.578 2.761.382 3.186.667 3.401.489 4.512.958 Total Liabilities
Modal Saham 199.514 199.514 199.514 199.514 226.181 Share Capital
Agio Saham 944 944 944 944 54.278 Additional Paid-in Capital
Biaya Perolehan Saham Treasury (3.273) (3.273) (3.273) (3.273) (3.273) Treasury Share Acquisition Expense
Saldo Laba/(akumulasi kerugian) 920.297 863.837 514.543 (148.821) (507.625) Retained Earnings (accumulated losses)
Surplus revaluasi tanah - - - - 478.820 Revaluation surplus of land
Kepentingan non-pengendali - - 12.148 79.367 171.086 Non-controlling interest
Selisih transaksi dengan - - - - 16.390 Difference in transaction with non-
kepentingan non-pengendali controlling interest
Ekuitas 1.117.483 1.061.023 723.877 127.731 435.857 Total Equity
Total Liabilitas dan Ekuitas 3.501.061 3.822.405 3.910.544 3.529.220 4.948.815 Total Liabilities and Equity
Laporan Arus Kas Statement of Cash Flows
Kas neto yang diperoleh dari (18.216) 267.500 383.332 148.560 203.923 Net cash provided by (used in) operating
(digunakan untuk) aktivitas operasi activities
Kas neto yang digunakan untuk (273.880) (341.395) (712.019) (293.618) (1.019.778) Net cash used in investment activities
aktivitas investasi
Kas neto yang diperoleh dari Net cash provided by (used in) financing
(digunakan untuk) aktivitas 9.825 19.640 (15.565) 248 898.226 activities
pendanaan
(Penurunan) Kenaikan Neto Kas (282.271) (54.254) (344.252) (144.810) 82.371 Net (Decrease) Increase in Cash and
dan Setara Kas Cash Equivalent
Kas dan Setara Kas Awal Tahun 882.912 601.014 208.855 208.855 64.830 Cash and Cash Equivalents at the
Beginning of the Year
Cash and Cash Equivalents at the End of
Kas dan Setara Kas Akhir Tahun 601.014 548.931 208.855 64.830 147.222
the Year
Jumlah Laba (Rugi) yang Dapat Diatribusikan Kepada: Total Profit (Loss) Attributable to:
Pemilik Entitas Induk (300.610) (77.448) (415.655) (796.712) (366.049) Parent Entity
Kepentingan Non Pengendali - - (2.557) (1.535) (3.194) Non-controlling Interest
Jumlah Laba (Rugi) Komprehensif yang Dapat Diatribusikan Total Profit (Loss) Comprehensive Attributable to:
Kepada:
Pemilik Entitas Induk (248.879) (56.461) (349.293) (663.365) 120.016 Parent Entity
Kepentingan Non Pengendali - - (2.557) (1.535) 53.670 Non-controlling Interest
10 PT Fast Food Indonesia Tbk | Laporan Tahunan 2025