
Page 12 - Annual Report PT Fast Food Indonesia Tbk 2019
P. 12
IKHTISAR KINERJA UTAMA
IKHTISAR KINERJA UT AMA lAPoRAN MANAJEMEN PRofIl PERUSAHAAN ANAlISIS & PEMbAHASAN MANAJEMEN
E
g
H
H
HTS
RMAN
PERfoRMANcE HIgHlIgHTS MANAgEMENT REPoRTS coMPANy PRofIlE MANAgEMENT’S DIScUSSIoN & ANAlySIS
P
ER
l
I
g
c
I
fo
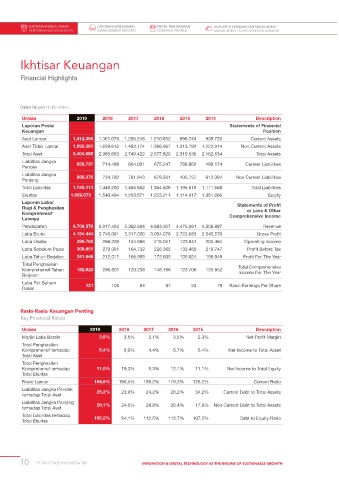
Ikhtisar Keuangan
Financial Highlights
Dalam Rp juta | In Rp million
Uraian 2019 2018 2017 2016 2015 2014 Description
Laporan Posisi statements of Financial
Keuangan Position
Aset Lancar 1.412.305 1.361.078 1.256.248 1.210.852 996.744 939.720 Current Assets
Aset Tidak Lancar 1.992.381 1.628.615 1.493.174 1.366.967 1.313.792 1.222.914 Non Current Assets
Total Aset 3.404.685 2.989.693 2.749.422 2.577.820 2.310.536 2.162.634 Total Assets
Liabilitas Jangka 856.737
Pendek 714.498 664.001 675.247 789.862 499.174 Current Liabilities
Liabilitas Jangka 888.376
Panjang 734.702 791.843 679.361 405.757 612.394 Non Current Liabilities
Total Liabilitas 1.745.113 1.449.200 1.455.852 1.354.609 1.195.619 1.111.568 Total Liabilities
Ekuitas 1.659.573 1.540.494 1.293.571 1.223.211 1.114.917 1.051.066 Equity
Laporan Laba/
rugi & Penghasilan statements of Profit
or Loss & other
Komprehensif Comprehensive income
Lainnya
Pendapatan 6.706.376 6.017.492 5.302.684 4.883.307 4.475.061 4.208.887 Revenue
Laba Bruto 4.194.444 3.740.091 3.317.020 3.054.078 2.723.683 2.542.570 Gross Profit
Laba Usaha 286.792 266.226 154.966 218.051 123.841 205.464 Operating Income
Laba Sebelum Pajak 309.651 279.091 164.732 226.365 133.455 216.747 Profit Before Tax
Laba Tahun Berjalan 241.548 212.011 166.999 172.605 105.024 156.049 Profit For The Year
Total Penghasilan Total Comprehensive
Komprehensif Tahun 182.923 296.801 120.238 148.196 123.706 125.952
Berjalan Income For The Year
Laba Per Saham 121 106 84 87 53 78 Basic Earnings Per Share
Dasar
Rasio-Rasio keuangan Penting
Key Financial ratios
Uraian 2019 2018 2017 2016 2015 Description
Marjin Laba Bersih 3,6% 3,5% 3.1% 3.5% 2.3% Net Profit Margin
Total Penghasilan
Komprehensif terhadap 5,4% 9,9% 4.4% 5.7% 5.4% Net Income to Total Asset
Total Aset
Total Penghasilan
Komprehensif terhadap 11,0% 19,3% 9.3% 12.1% 11.1% Net Income to Total Equity
Total Ekuitas
Rasio Lancar 164,8% 190,5% 189.2% 179.3% 126.2% Current Ratio
Liabilitas Jangka Pendek 25,2% 23,9% 24.2% 26.2% 34.2% Current Debt to Total Assets
terhadap Total Aset
Liabilitas Jangka Panjang 26,1% 24,6% 28.8% 26.4% 17.6% Non Current Debt to Total Assets
terhadap Total Aset
Total Liabilitas terhadap 105,2% 94,1% 112.5% 110.7% 107.2% Debt to Equity Ratio
Total Ekuitas
10 PT FAST FOOD INDONESIA TBK INNOVATION & DIGITAL TECHNOLOGY AS THE ENGINE OF SUSTAINABLE GROWTH